Quoted a Seven Year Payback? The Four Numbers Behind It, and Which One Actually Moves
A payback estimate is built from four inputs, and only one of them is stable. Here is how to test the number against your own bills before you sign.
Nikolai Dragomir5 min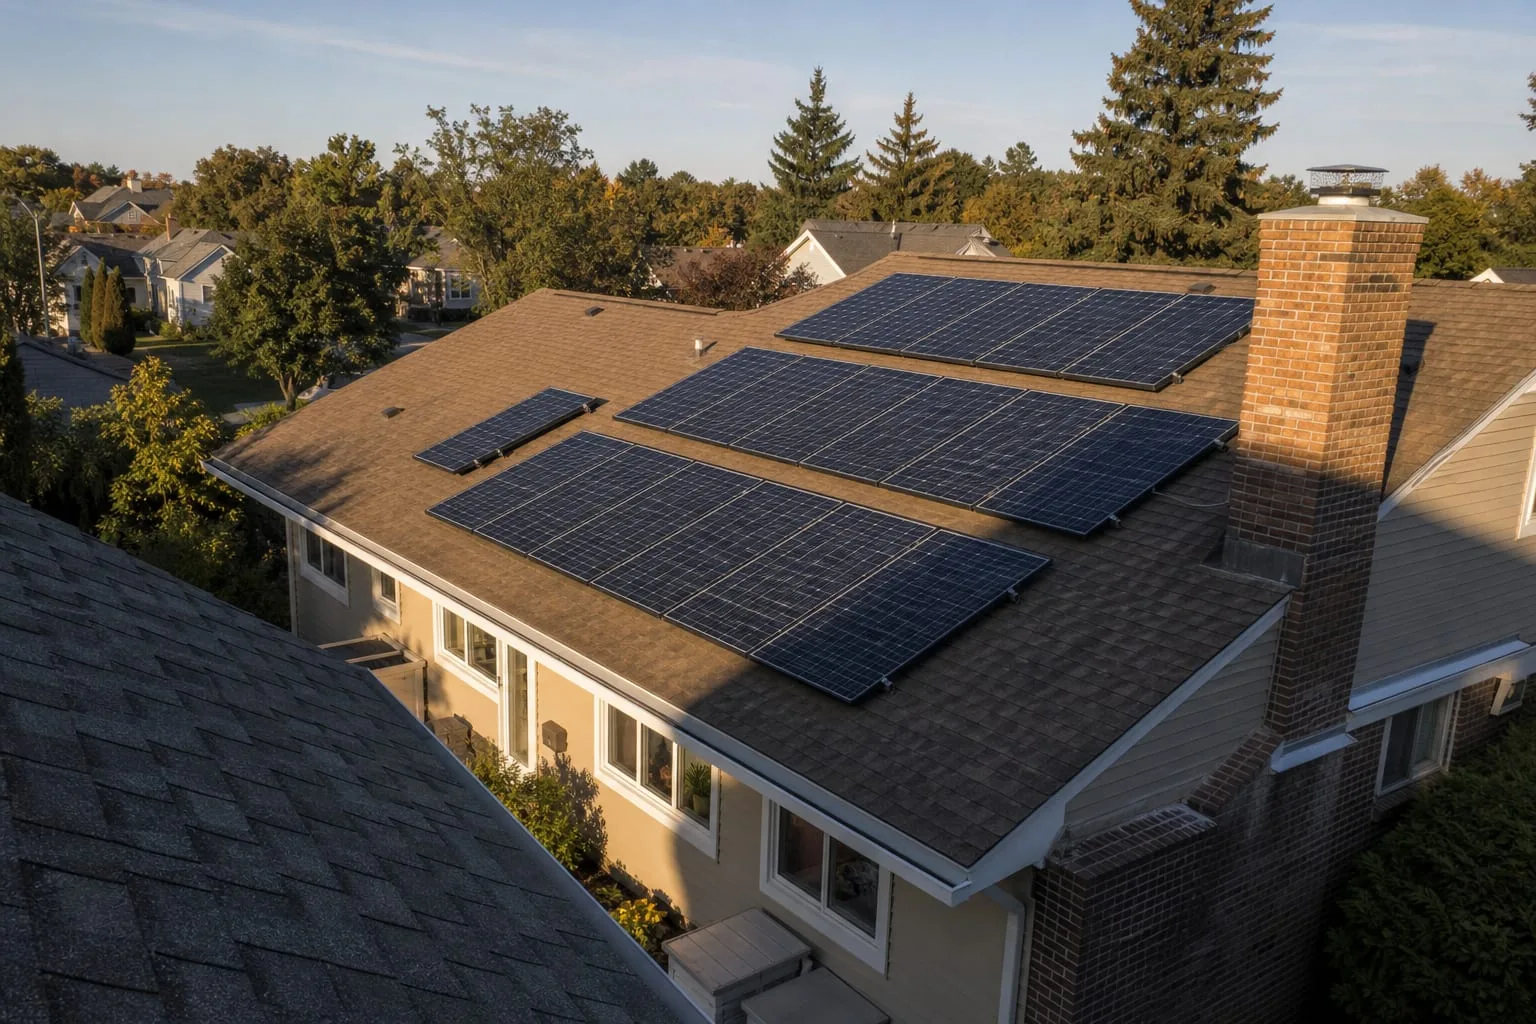
The number on the front of the proposal, the one that says the system pays for itself in seven years or nine or eleven, is not a measurement. It is the output of four assumptions stacked on top of each other, and a homeowner can check three of them in an evening with twelve months of utility bills and a calculator. The fourth is a forecast about what your utility will charge a decade from now, and nobody can check that. Knowing which is which is the whole exercise, because it tells you where a bad quote hides its optimism.
Open the bills before you open the proposal
Pull twelve consecutive months of statements and find two figures on each: total kilowatt-hours used, and total dollars billed including every fixed charge, rider and tax. Divide the second by the first and you have your real blended rate, which is almost always higher than the per-kilowatt-hour rate printed in the rate schedule and almost always lower than the rate a salesperson quotes when arguing for a fast payback. Do it month by month, not as an annual average. The spread between your July rate and your March rate tells you more about the honesty of a proposal than any single line in it.
Then find the part of your bill that solar cannot touch. Most utilities charge a fixed monthly customer charge, and many add distribution or delivery components that scale with usage but are billed separately from generation. A system that zeroes out your consumption does not zero out your bill, and a proposal that models it that way has inflated the savings by whatever those charges come to over twenty-five years. That figure is knowable tonight. Write it down before anyone else writes it down for you.
How the payback calculation came to be built this way
The arithmetic everyone still uses was shaped in an era when the compensation rule was simple. Under full retail net metering, a kilowatt-hour exported at noon canceled a kilowatt-hour imported at nine in the evening, one for one, which meant annual production was the only production number that mattered. You sized the array against the annual bill, divided the net cost by the annual savings, and the answer was a single integer. Hardware was the expensive part, so most of the analytical effort went into the equipment line, and the rate side was treated as a constant.
Hardware prices fell for two decades while that convention stayed in place, and the result is a strange inversion: the component the industry got very good at estimating is now the smaller half of the answer, and the component it never had to estimate carefully is the larger half. Many states have since moved toward net billing, time-of-use residential rates, or export credits set below the retail rate, which means the hour a kilowatt-hour is produced now changes what it is worth. The Department of Energy tracks residential solar deployment and cost trends nationally, and the practical consequence for a homeowner is that two identical arrays on identical roofs in different service territories can have payback periods years apart.
So the modern version of the calculation has four inputs rather than two: net installed cost after the federal credit and any state or utility incentive, annual production from your specific roof, the value of a kilowatt-hour you consume on site, and the separate and usually lower value of one you export. A proposal that does not distinguish the last two is using a method that made sense under the old rule and has not been updated.
What the week-to-week reality actually looks like
Households expect a switch to flip and the bill to vanish. What happens instead is quieter and takes a year to read. In April and May the system frequently overproduces, banking credits; in July the air conditioning eats them; in December production drops to a fraction of the summer figure while usage climbs, and the bill comes back. If you watch monthly, you will conclude twice a year that the system underperformed and twice a year that it overperformed. The only meaningful reading is the annual true-up, the month your utility settles the accumulated credits and tells you where you actually stand.
Between true-ups, the useful habit is small. Once a week, glance at the inverter app or the utility's usage portal and confirm production is happening at all, because the failure mode that costs real money is not a slightly underperforming array, it is a string or an inverter that went dark in February and got noticed in June. Four months of silent zero is a genuine hit to the payback math. A thirty second check catches it, and most monitoring platforms will send an alert if you turn alerts on during the first week, when the installer is still answering the phone.
Shifting load is the other week-to-week lever, and under a time-of-use rate it is worth more than most people expect. Running the dishwasher, the laundry and the electric vehicle charger during the middle of the day converts exported kilowatt-hours, credited at the lower export rate, into consumed kilowatt-hours that offset the full retail rate. Nothing about the hardware changes. The household changes when it does two or three routine things, and the annual settlement moves in the right direction.
The roof is the input the spreadsheet handles worst
Production models are good at latitude, azimuth and pitch, and they are worse at the chimney, the neighbor's silver maple, and the dormer that shades the southwest corner from two in the afternoon onward in October. Ask for the shade analysis as a separate document with the measurement dates, and ask specifically how the model treats mature trees over twenty five years. Ask, too, about the roof covering itself. Removing and reinstalling an array to replace shingles underneath is a real cost, and if the roof has fewer than ten years left, the honest sequence is to re-roof first and mount once.
Get that sequence right and the rest of the analysis holds together, because the array stays where it was installed for its whole productive life. That is also the moment to confirm attachment details, flashing, and how the installer warrants penetrations, which is a separate warranty from the one covering the panels.
Recompute after the first true-up using the numbers your own meter produced, not the ones in the proposal, and you will have a payback figure that is genuinely yours. Most households find it lands within a year or two of the estimate, and the ones that do better are usually the ones who moved the laundry.